

Your dashboard
Signing in lands on your campaigns, with every action a labeled button; analytics live under Reports.
Signing in lands you on Campaigns at /dashboard: the thing you actually work on, one click from everything. Each campaign is a row with its logo, name, a stats line (rate, affiliates, sales in the last 30 days, plus leads and paid clicks in the last 30 days when the campaign pays for those, unpaid commission), and a row of labeled actions, so nothing is hidden behind a click-and-hope table row. Your numbers live one click away under Reports.
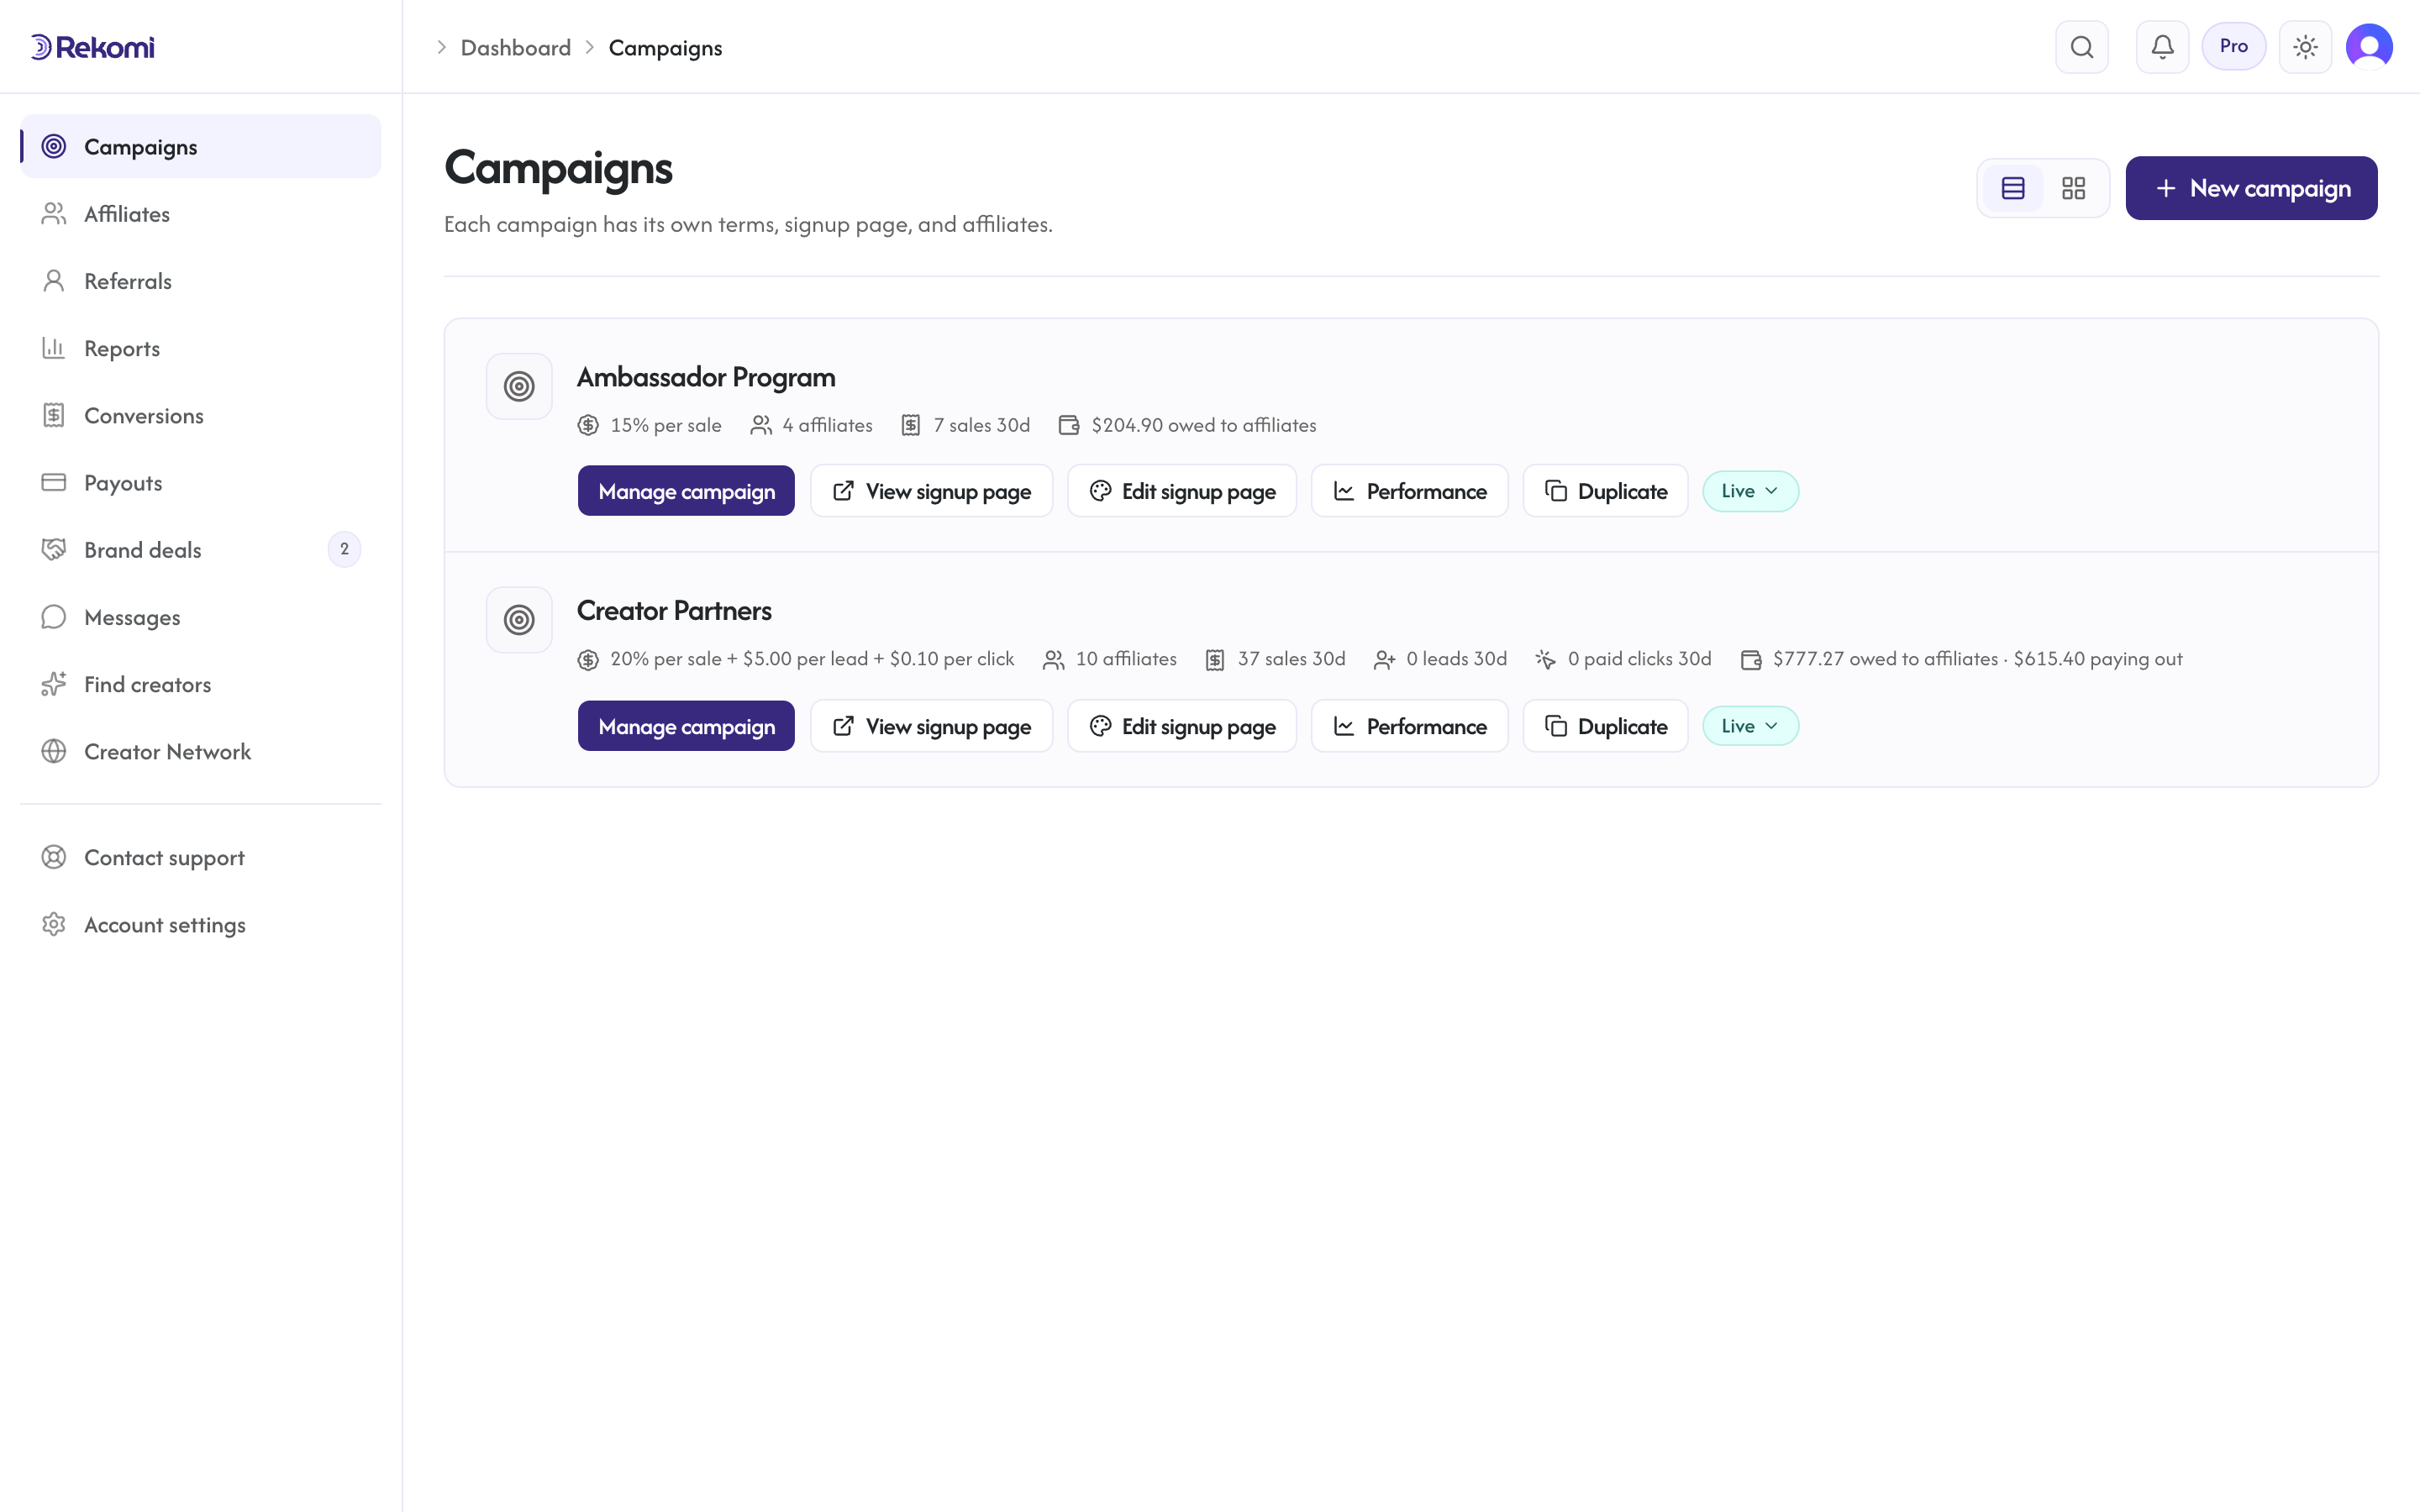
The campaign actions
Every campaign row carries the same buttons:
- Manage campaign: opens the campaign's detail page (overview, affiliates, performance, commission, coupons, promo materials, emails, settings).
- View signup page: opens the public page affiliates use to join, in a new tab.
- Edit signup page: opens the signup page editor.
- Performance: jumps straight to the campaign's performance tab.
- Duplicate: creates a new campaign prefilled with this one's settings.
- The status pill (Live or Paused) is a dropdown: pause or resume the campaign right from the list. Archiving lives at the bottom of the campaign's Campaign settings tab.
A layout switcher in the header flips between rows and a card grid; your choice is remembered. The New campaign button is always top-right.
Your suggested next step
Above the list, the dashboard shows one suggestion at a time, based on where your account actually is:
- No campaigns yet: Create your first campaign.
- Campaigns but no approved affiliates: Invite your first affiliates.
- Affiliates but no clicks: Install the tracking snippet, then run a test sale.
- Clicks but no sales: Turn clicks into sales with coupons.
Each card is a shortcut, not a gate; you can do these steps in any order, and you can dismiss any suggestion for good. Once sales are flowing, the card disappears.
Where the numbers live
Reports (sidebar, or G then R) is the one analytics surface: KPIs, the trend chart, top affiliates, traffic sources, and CSV export, all scoped by a shared date range and campaign filter, with deeper reports on its pill nav. The Conversions page is the raw event log; Reports is the rollup.